Desktop Client

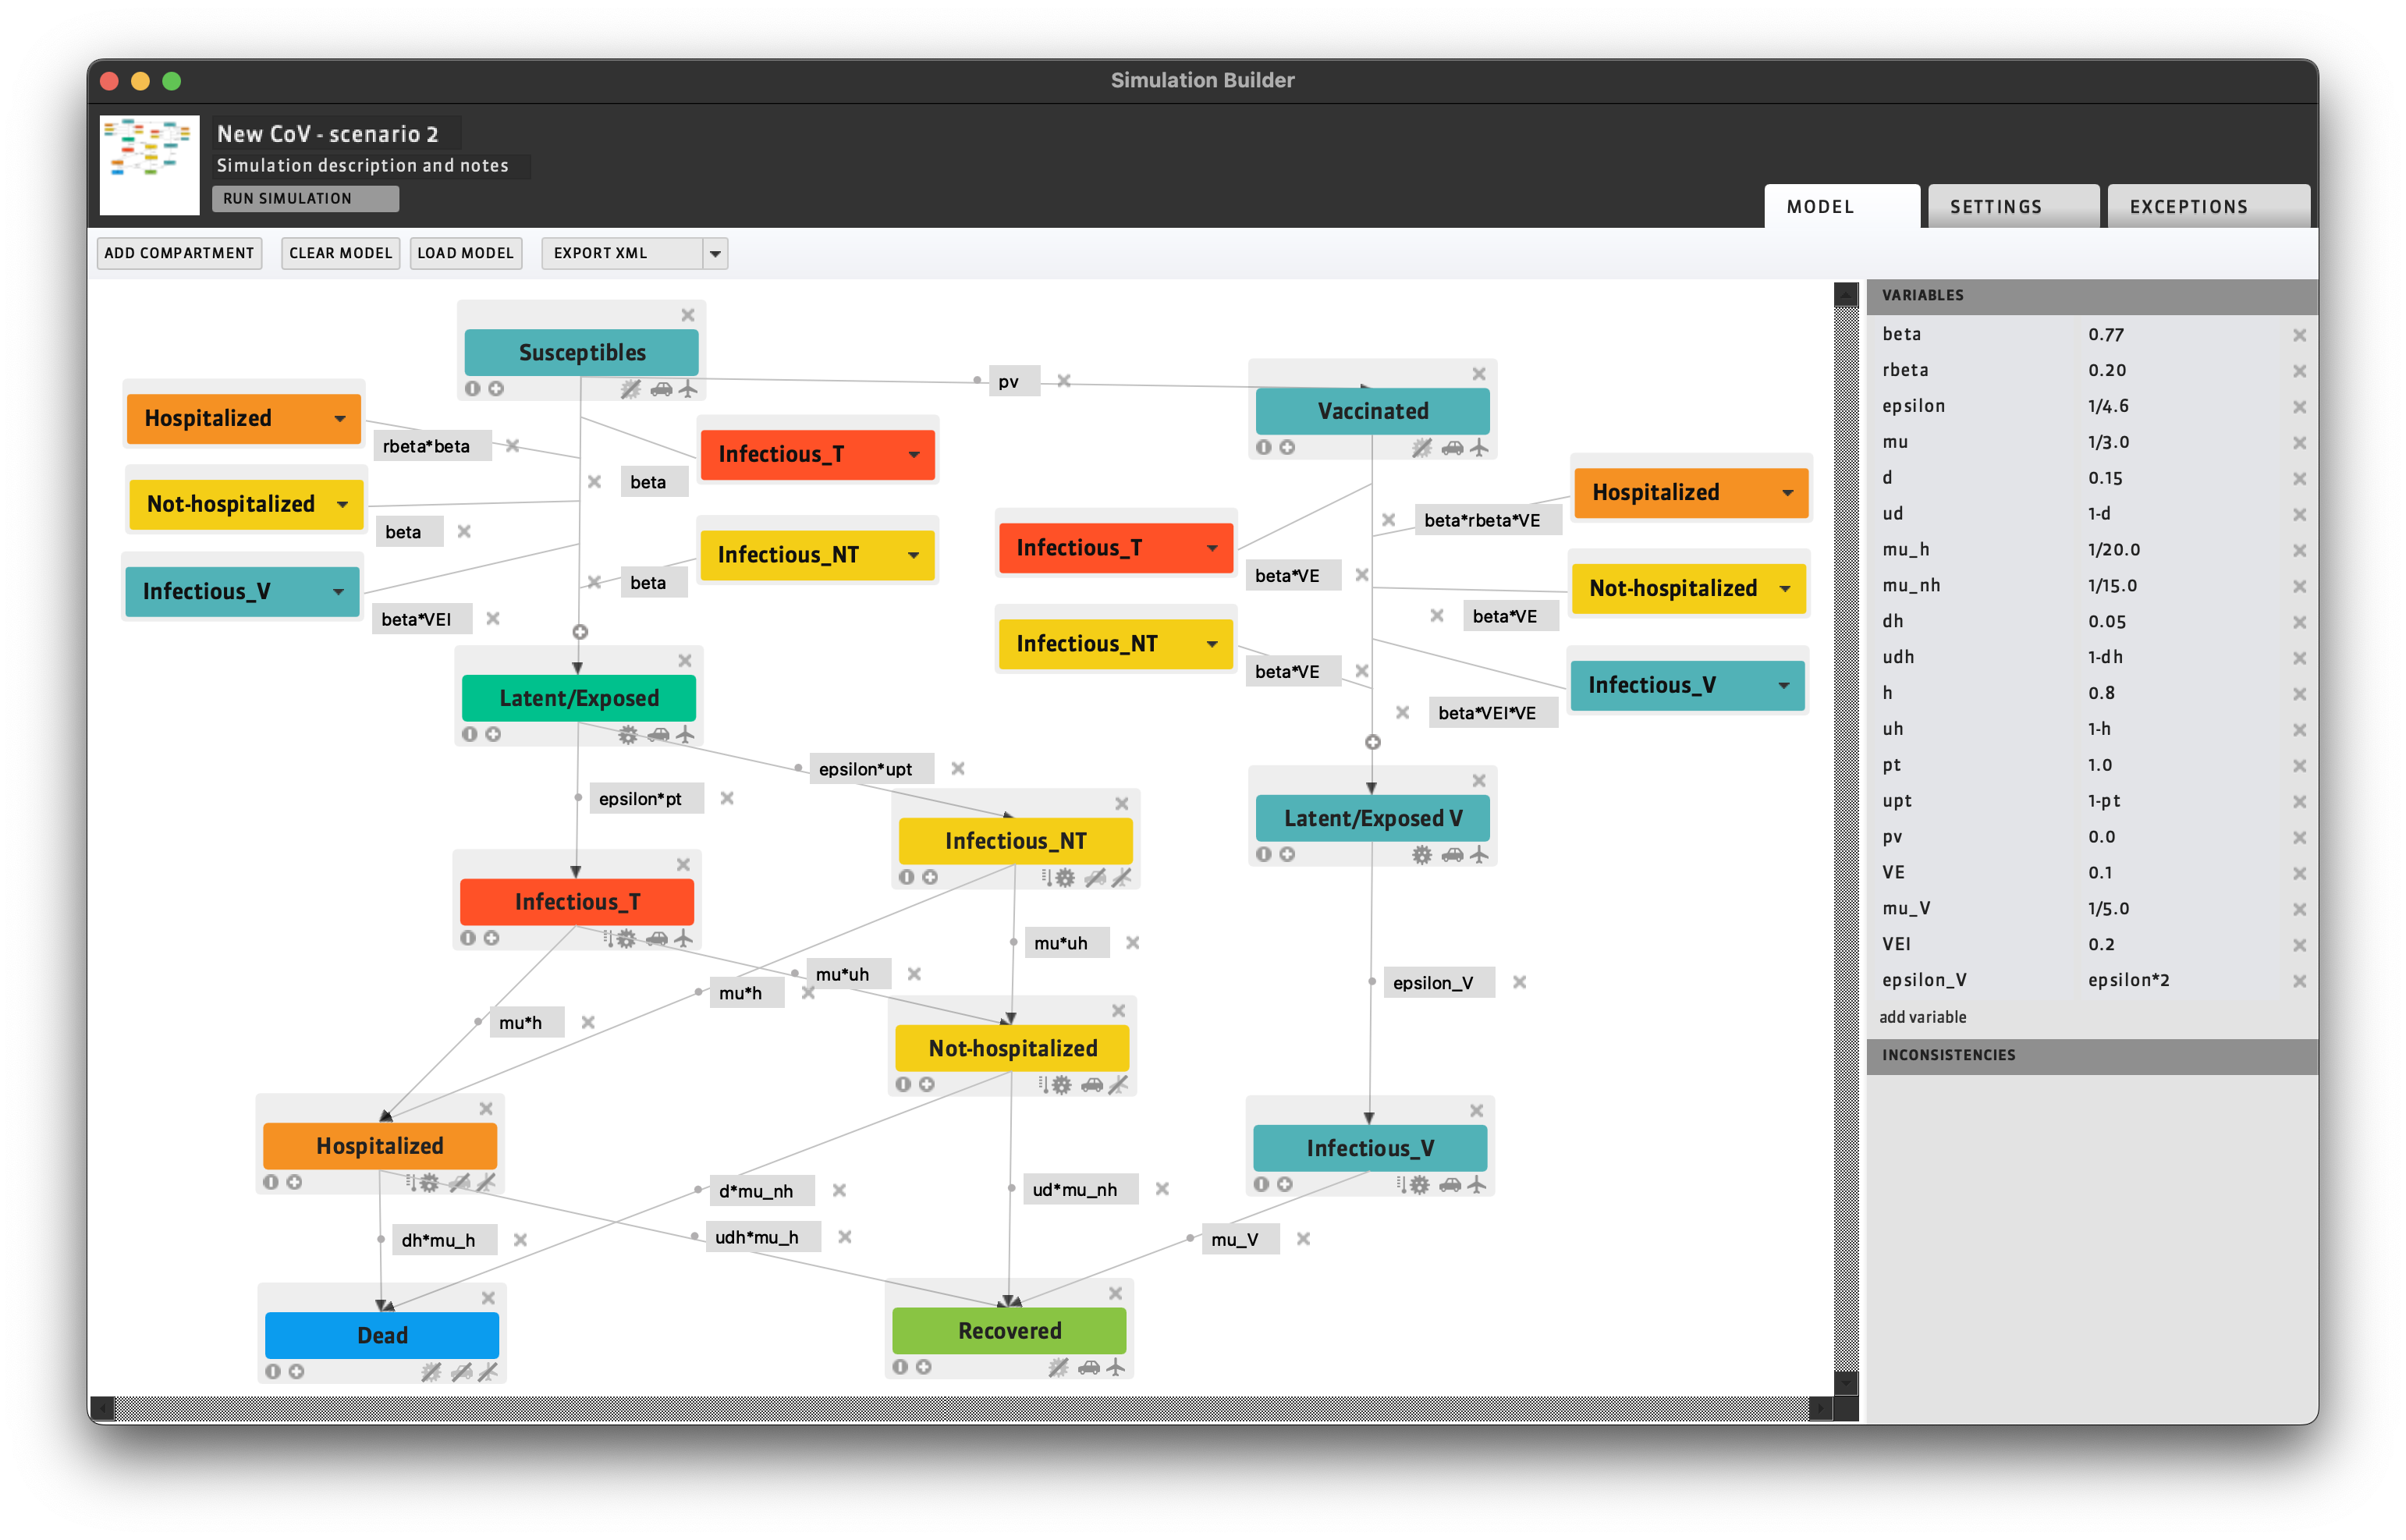
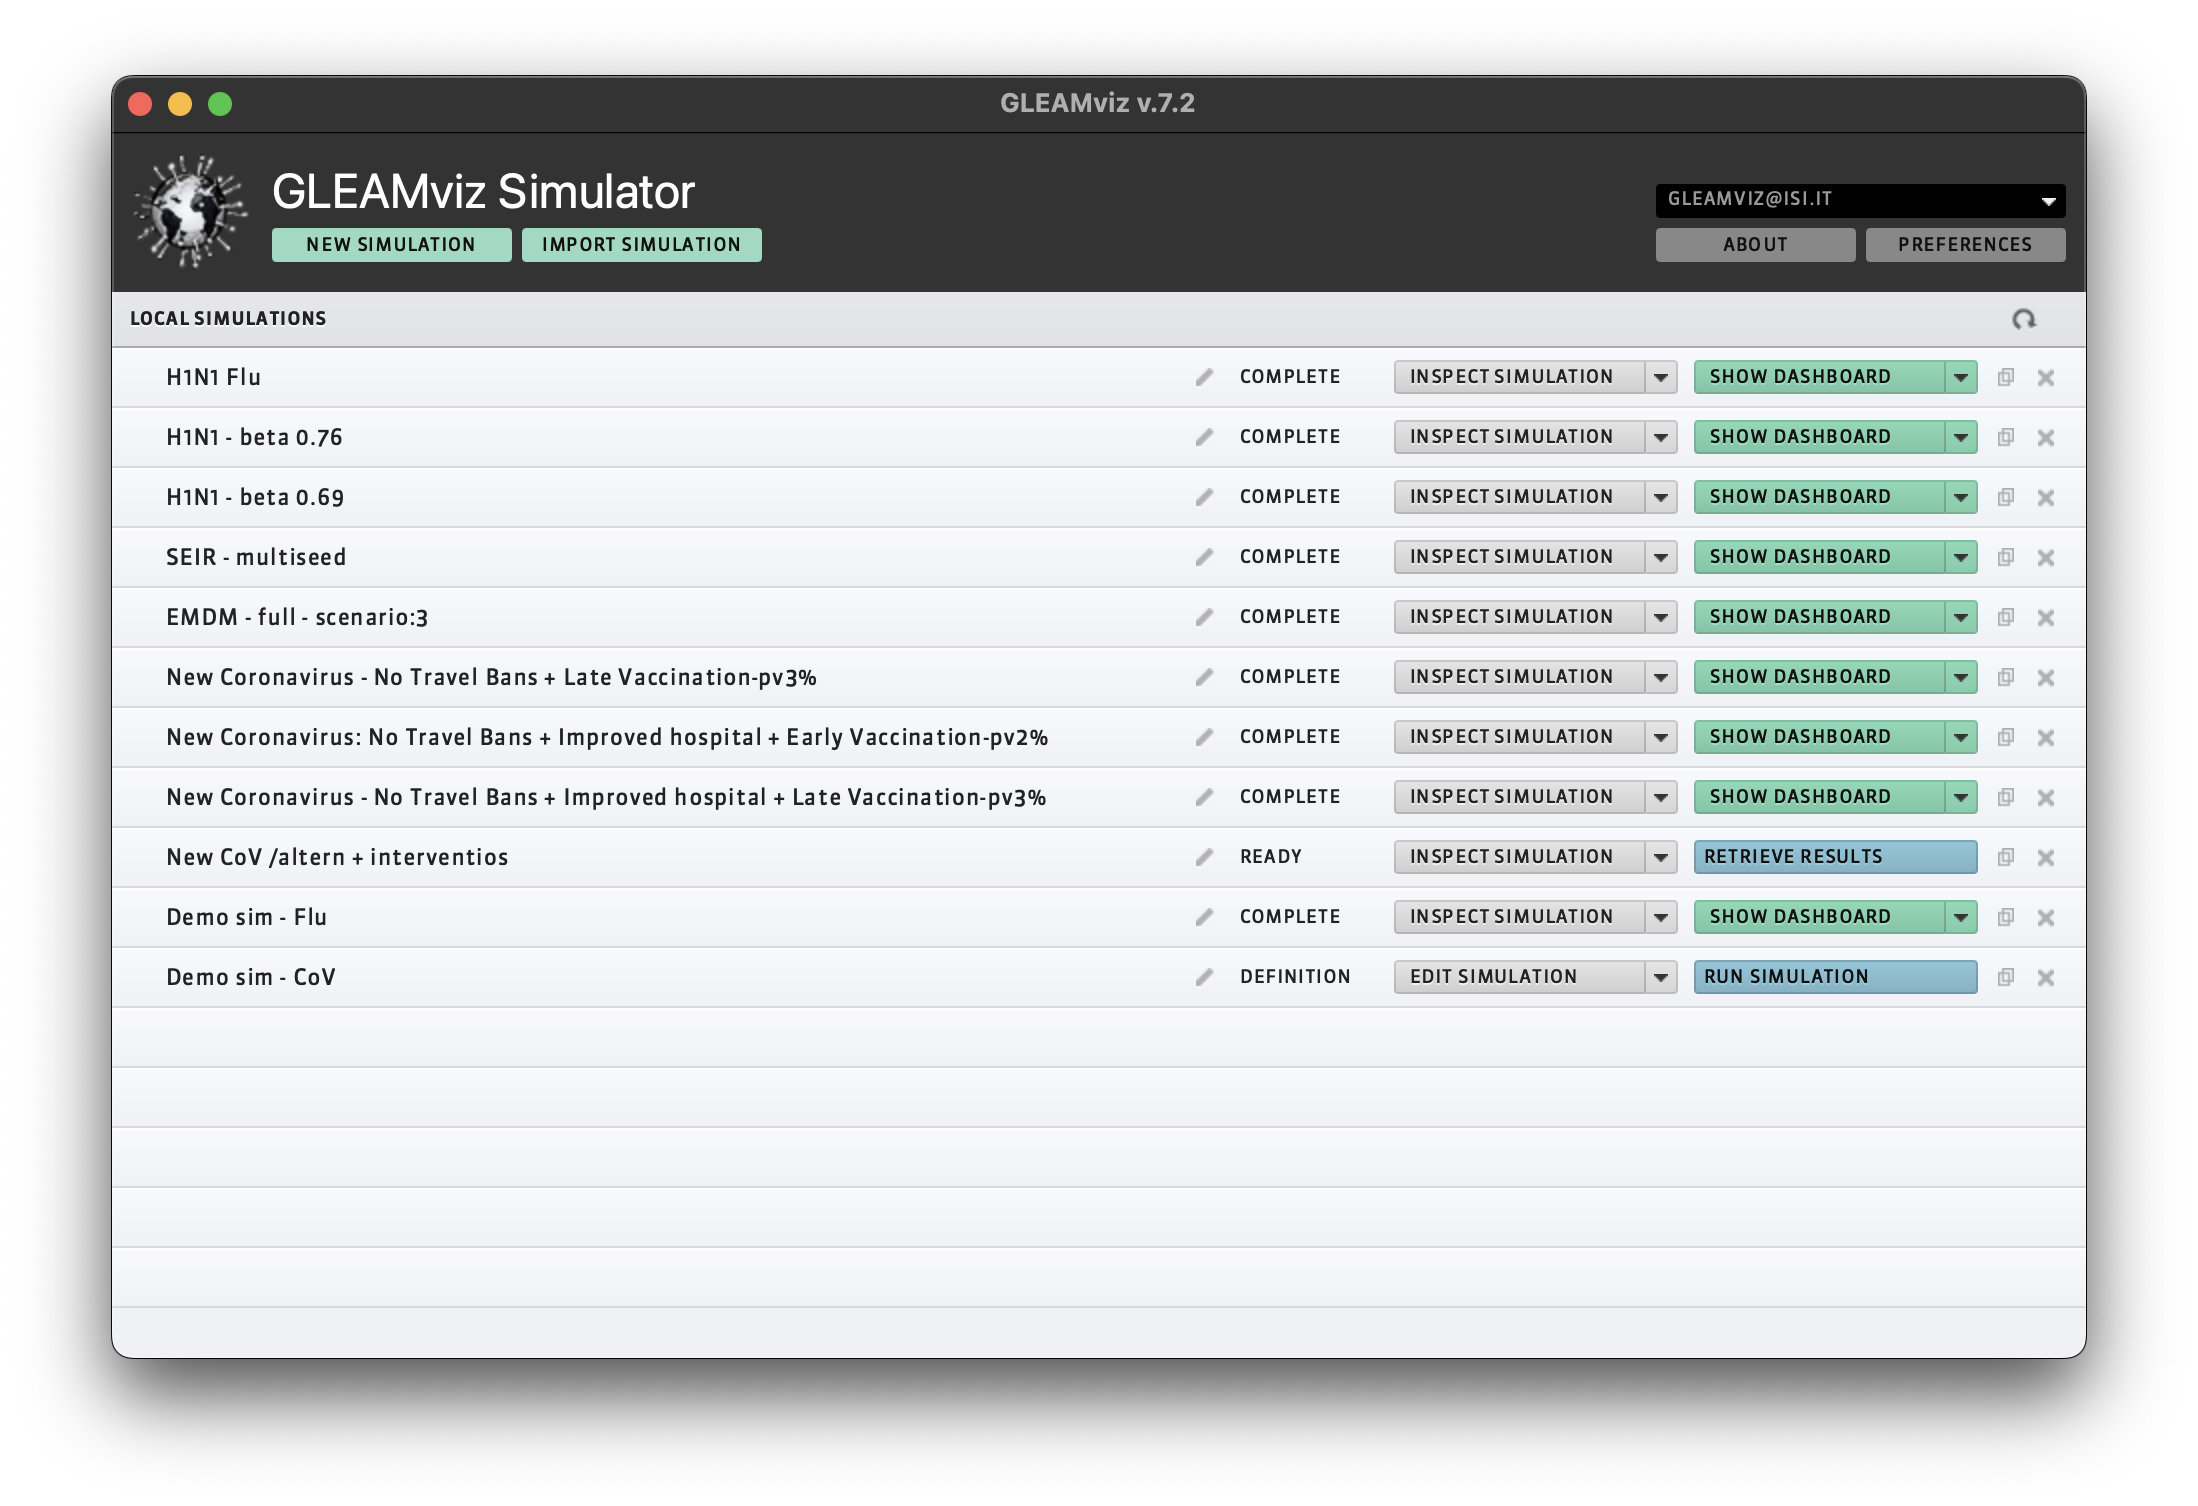
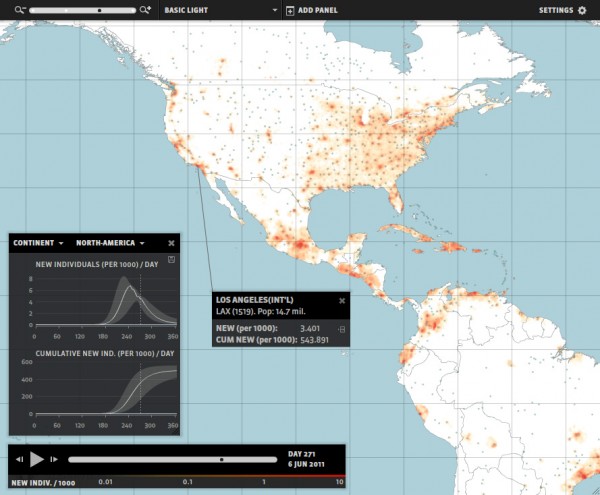
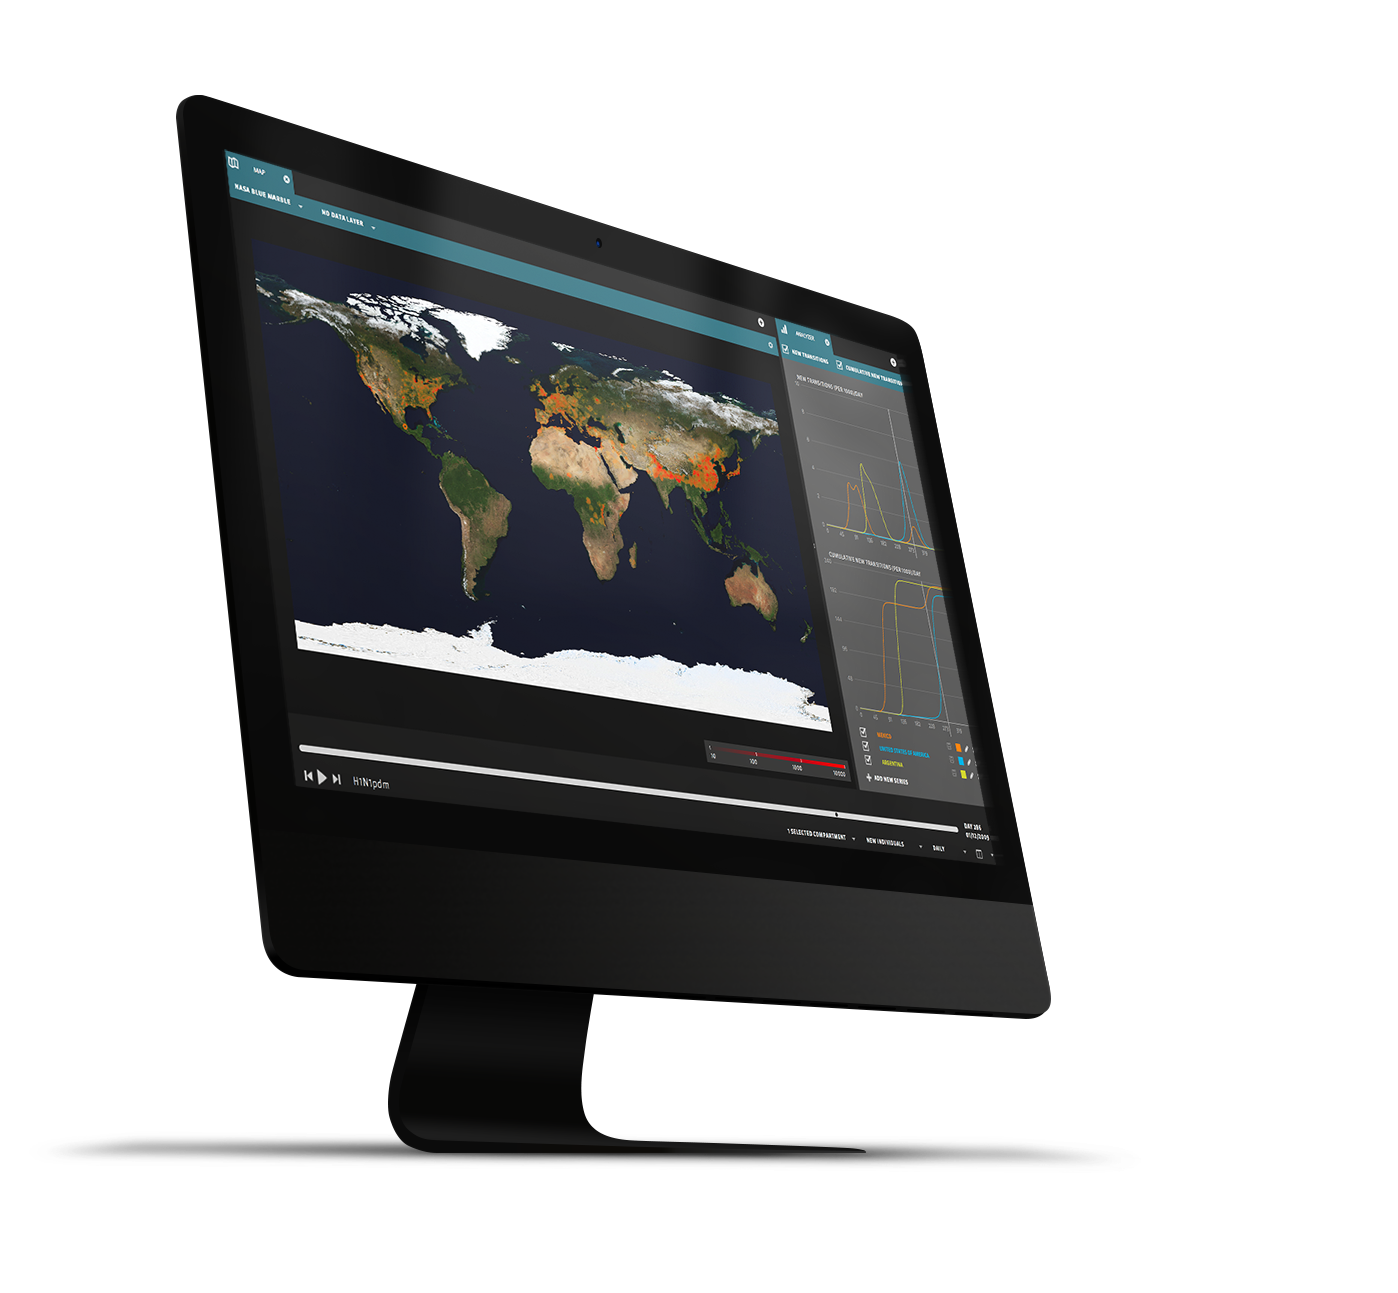
The GLEAMviz desktop application is the main interface through which users interact with the GLEAM engine. This desktop application provides a simple, intuitive and visual way to set up simulations, develop disease models, and evaluate simulation results using a variety of maps, charts and data analysis tools. We regularly add new features and refine our modeling interface and visualizations, and our charting capabilities.

You can install and test a public version of the GLEAMviz desktop application on your computer today!

Please consult the GLEAMviz client manual for details on how to set up and use the software components.

Simulation Builder

Before putting the GLEAM engine to work, you must first define the epidemic model and configure the simulation scenario. To help non-technical experts, GLEAMviz provides an intuitive graphical interface to make this modeling processes straightforward and flexible.

Simulation manager window.

Simulation Manager

Once defined, simulations can be submitted to the GLEAM engine that then performs the complicated statistical calculations. Once complete, the results are retrieved and stored by the Simulation Manager. This module also manages archived simulations and results, and allows you to inspect epidemic models, export data and launch visualizations.

Example of map visualization.

Visualization and analysis

GLEAMviz offers multiple visualization options, including customizable interactive charts, a zoomable map, an invasion tree representation, 3D globe displays, a graph of the mobility network, etc. The client manual describes all the visualization widgets currently available.

Visualization Gallery